ggplot(data = mpg) +
  geom_point(mapping =
               aes(x = displ,
                   y = hwy,
                   color = class) )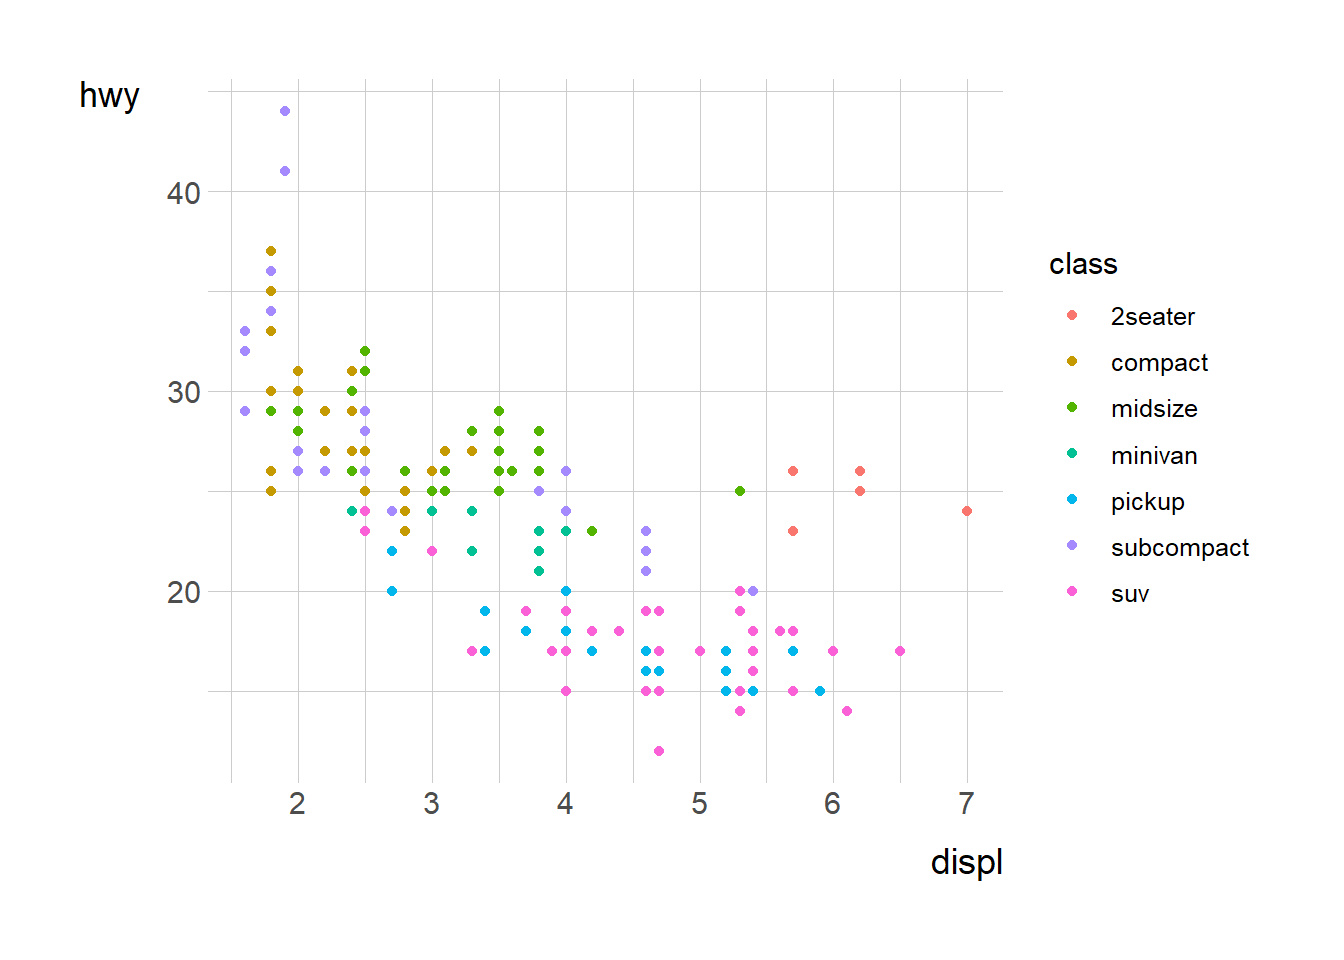
The ggplot functions allow for the creation of various visual charts and graphs to display the relationships between variables. We can use coding to determine specific graphs as well as the details in these graphs to make them more visually appealing to viewers. An example of a ggplot code is below.
ggplot(data = mpg) +
geom_point(mapping =
aes(x = displ,
y = hwy,
color = class) )